

Describing the issue

A longtime customer decided to have a new Wordpress website with an Elementor page builder for their travel agency Slovenia-trips.com.
While the page turned out looking good and inline with their needs, the performance seemed quite bad - just ~5reqs/sec with TTFB 2.0-2.5sec while running on a very decent VPS server (LXC VPS, 4vCPU with 2.9GHz base frequency, 4GB RAM, all served from NVMe). The fact that the webpage editor applied many known good practices (optimized images, plugins for minifying JS/CSS/HTML, etc.) did not make a desired difference. For some reason cache-ing plugins did not work as expected and that is probably the root cause of most slow Wordpress pages - if full page cache does not work, it's slow. Elementor being suc a "heavy" builder sure did not help.
To make matters a bit worse - this new site is aiming at foreign visitors and being the projected landing page for web ads.
As their hosting provider and server admin we wanted to help tackle this issue.
Having such speed issues even without operational cache did come as a small surprise as their other site Slotrips.si that we've developed couple of years back runs on a similar server. It's reaching 150 uncached reqs/sec (TTFB 80-150ms) and 1.000+ cached reqs/sec (TTFB < 10ms). All that while serving thousands of daily visitors.
To exclude hardware being the bottleneck we've put the webpage on the fastest PHP/Wordpress CPU at the time (i9-9900K) with DB on Intel Optane. Performance was better (TTFB 1.0-1.75sec) but still not enough. Also, you do not want to project the performance of your site based on the assumption that it will/should/must run on the fastest server setup.
These tests convinced us that it's not the hardware, but Wordpress/Elementor issue.
Implementing NGINX FastCGI - Full Page Cache
Since Wordpress cache plugins did not work as expected, we decided to try implementing NGINX FastCGI. It caches the response, saves it to its own cache storage and when the cache-HIT opportunity happens, it does not even "touch" the Wordpress code.
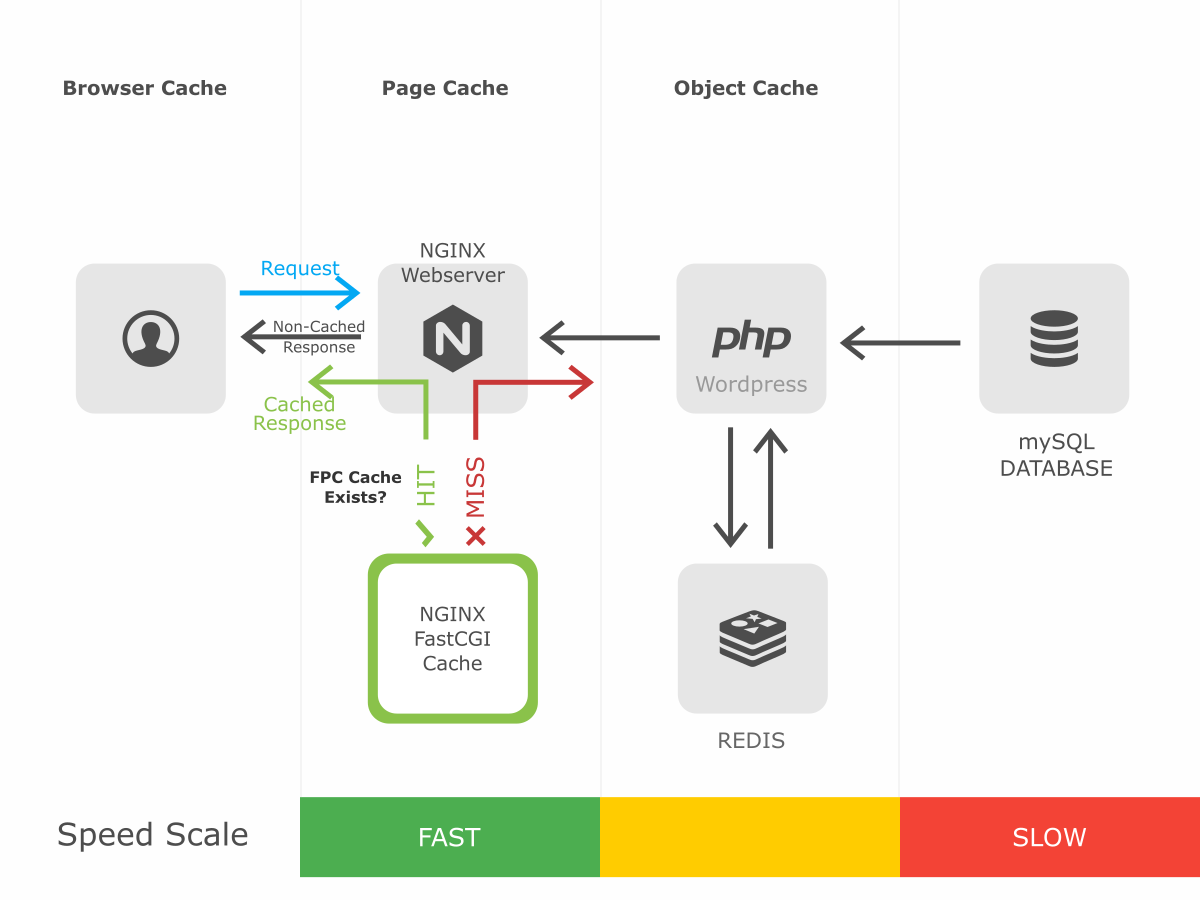
It did take us some time to set it up as wanted (target storage for cached files, TTL, HIT/MISS/BYPASS rules...) and check if Cache-purge works correctly on content updates in Wordpress. But after a couple of months passing by without any issues from the editors it seems we've found a stable solution to significantly speed up server response times even on "heavy" Elementor pages.
We are still pleasantly surprised by the improvements in speed this setup provides.
Results
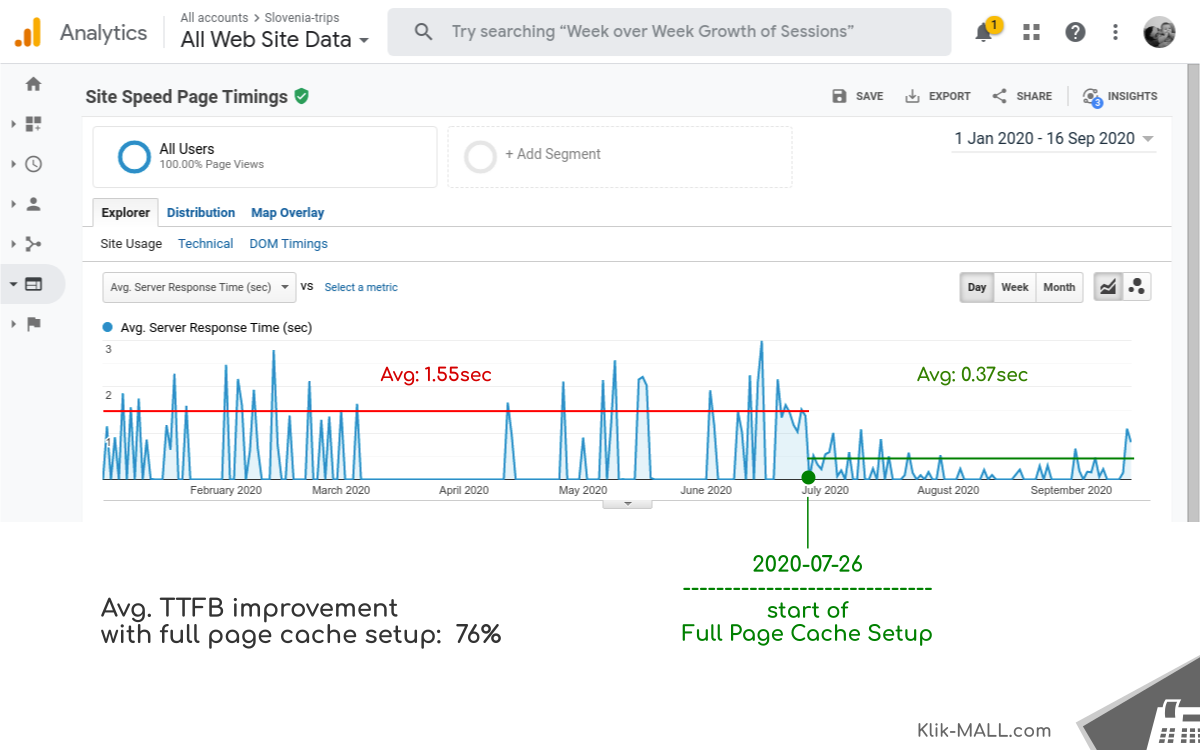
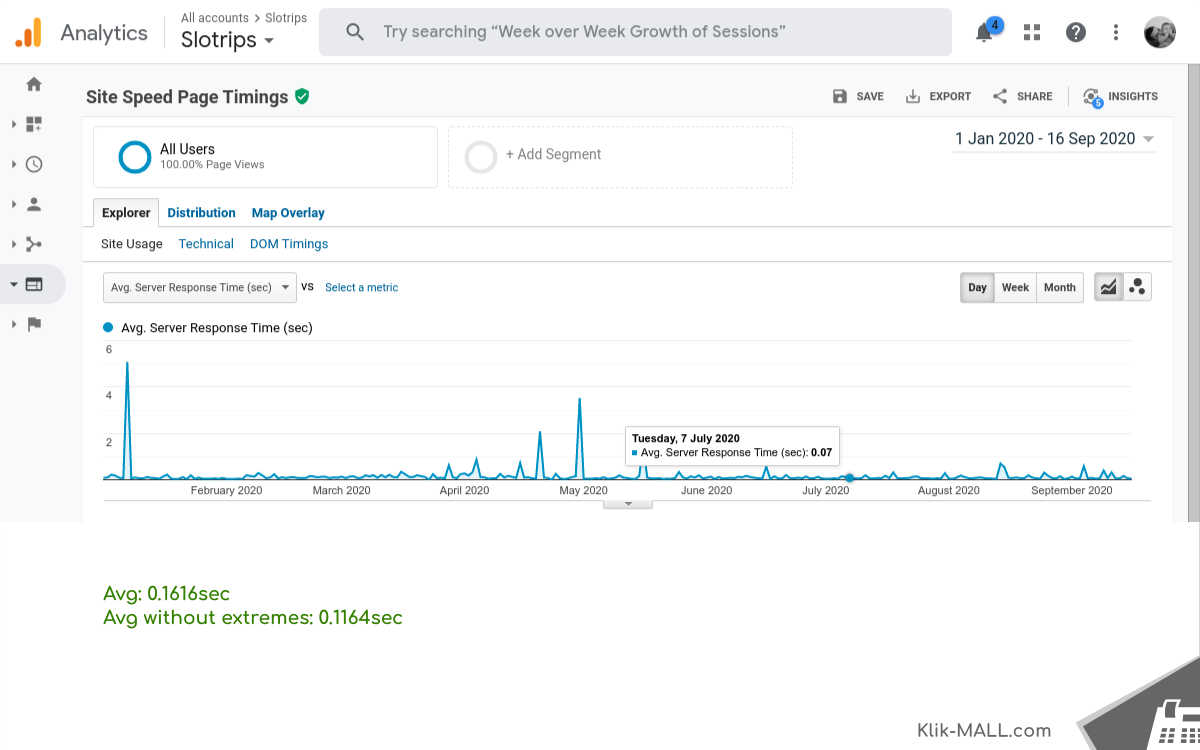
If we'd have to pick a single picture to best showcase the improvements NGINX FastCGI provided it would be this "Google Analytics > Server response time" report over couple of months. Report stores this data only for a small portion of all visitors, but it provides "real life" user results. This comes as a usefull information how much TTFB it takes for real users to start receiving the data. Picture is showing avg. server response times per GA by the same server with the only difference being implementation of FastCGI on 2020-07-26.
Other tests
| TEST | FastCGI NO | FastCGI YES | Diff. | Screenshot |
| NGINX FastCGI Cache Disabled / Enabled |  |
- | - | |
| Google Analytics (avg TTFB) | 1.55 | 0.37 | -76% | |
| Pingdom Website Speed test (TTFB/WAIT; in sec) | 831.9 | 145.2 | -83% | 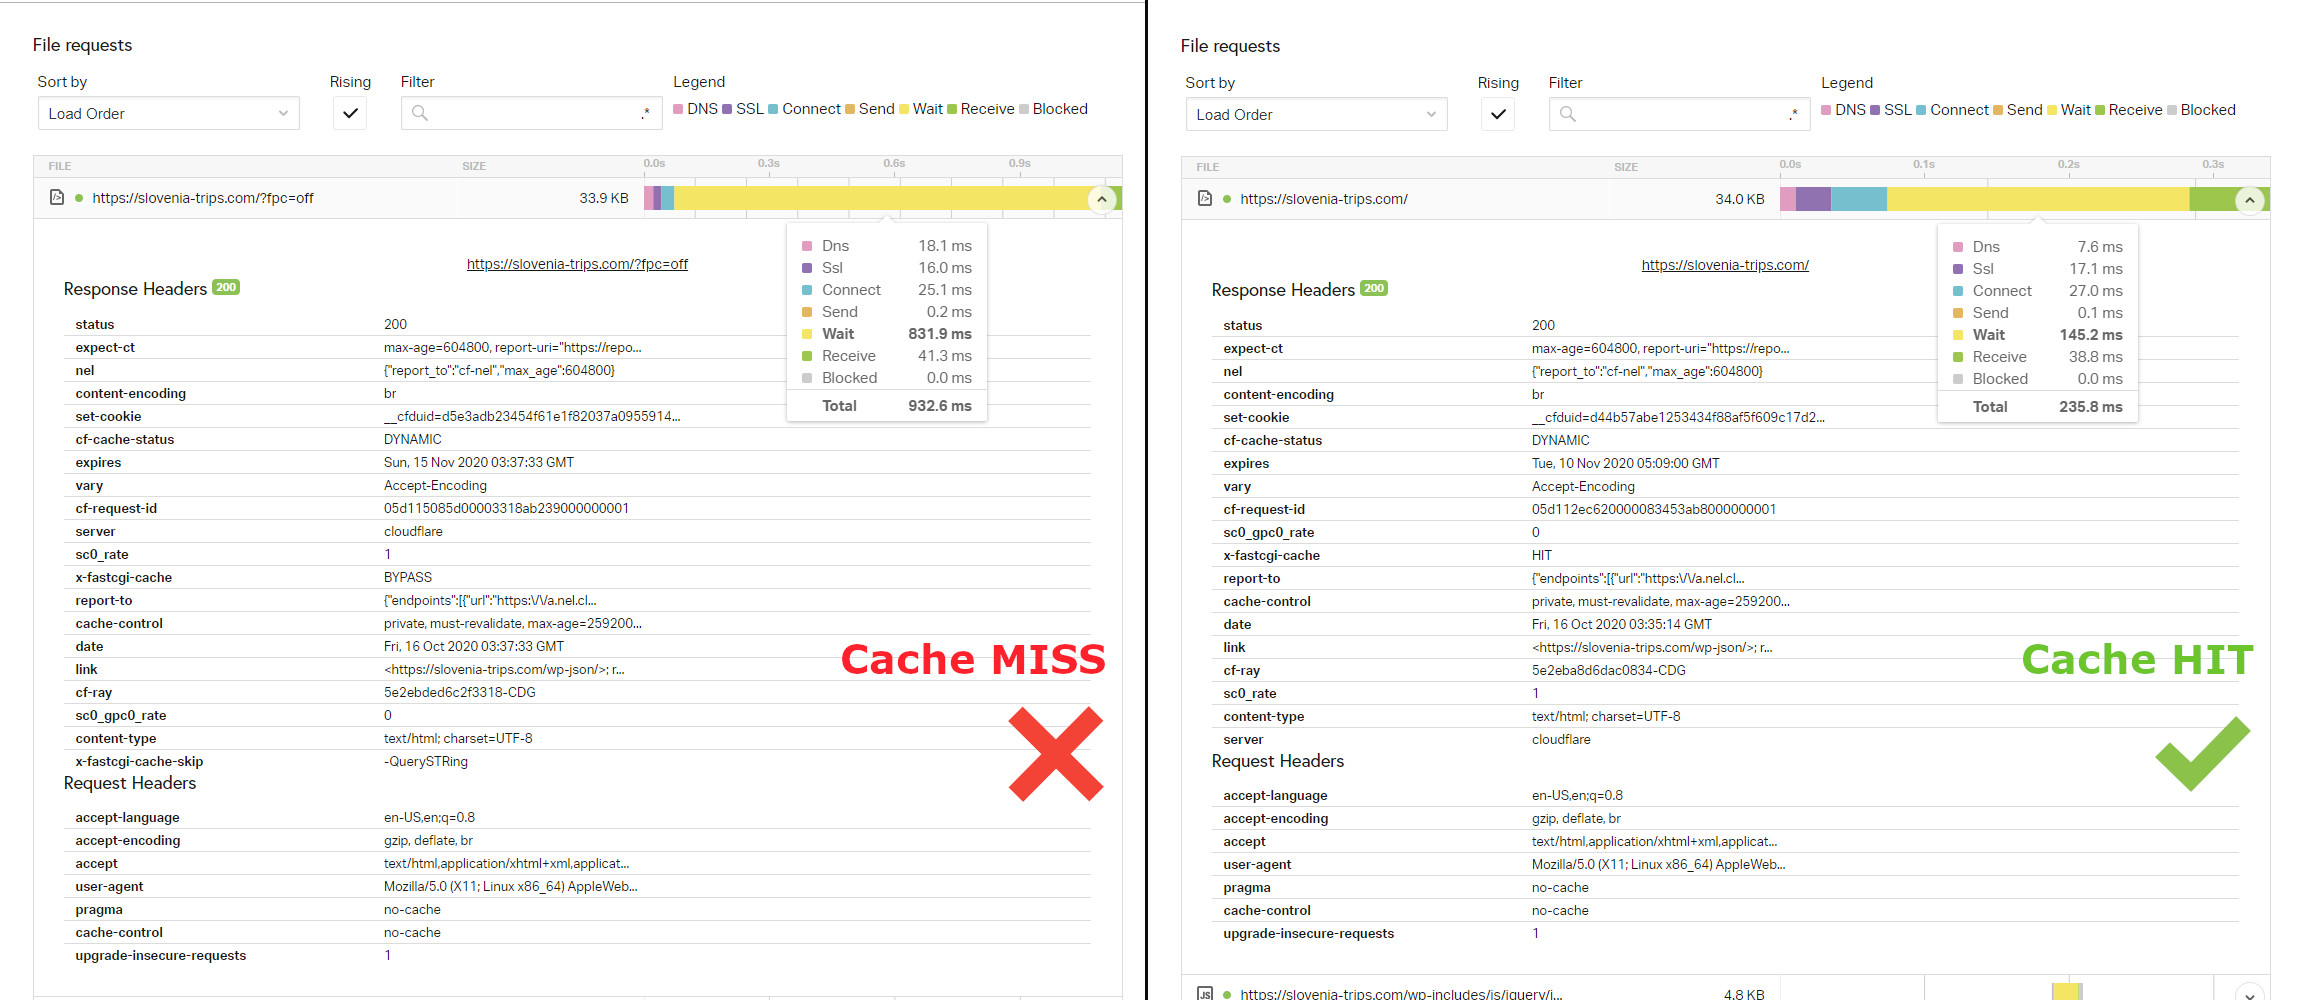 |
| Google Chrome test (TTFB; in ms) | 1.010 | 0.043 | -96% | 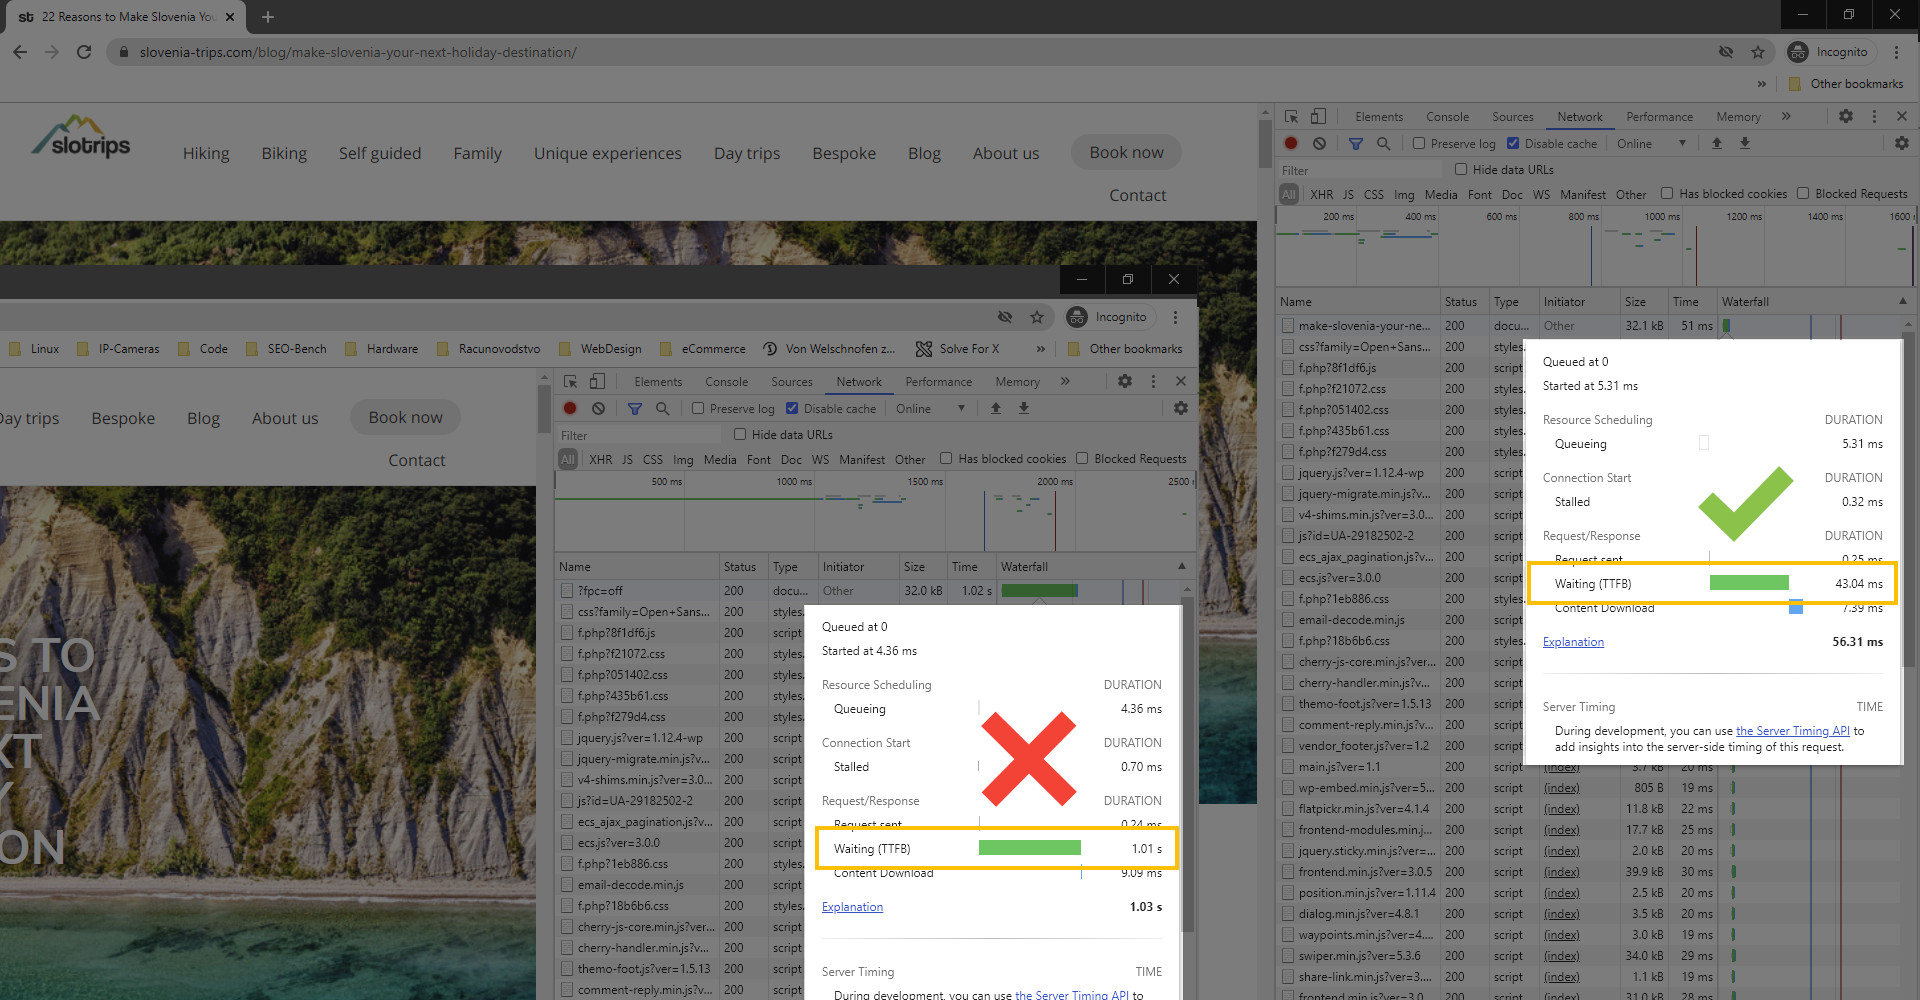 |
| Apache Bench (Reqs/sec) | 4.83 | 412.20 | 85x | 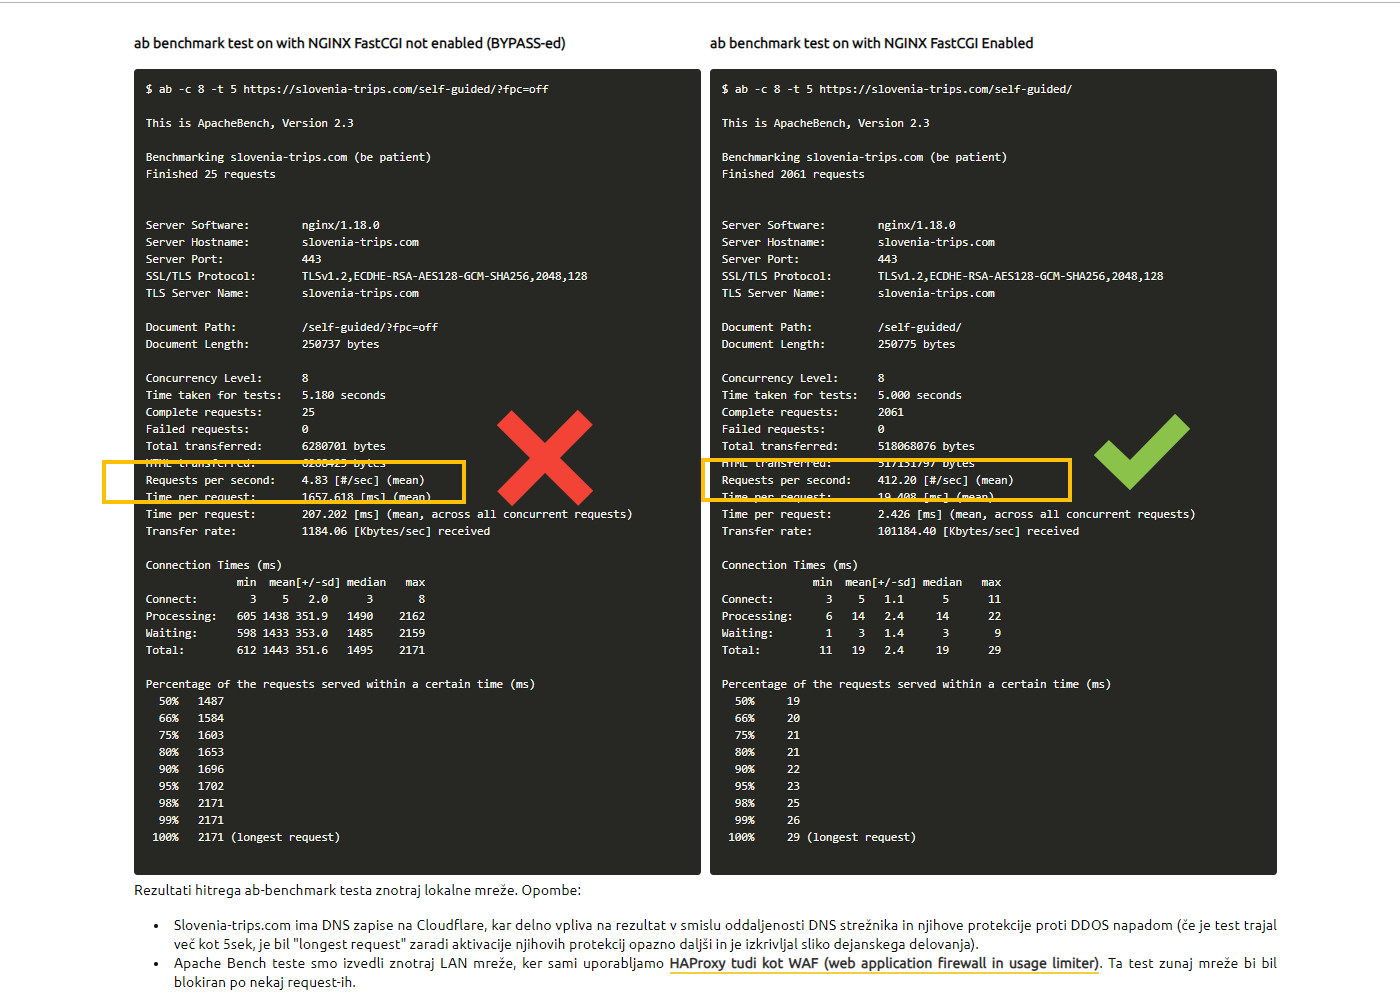 |
| TTFB via CURL (LAN test; terminal; in sec) | 1.67 s | 0.01 s | -99% | Below |
TTFB/CURL via Terminal test (NGINX FastCGI Disabled)
$ curl -o /dev/null -w "Connect: %{time_connect} TTFB: %{time_starttransfer} Total time: %{time_total}" https://slovenia-trips.com/?fpc=off
  % Total    % Received % Xferd  Average Speed   Time    Time     Time  Current
                                 Dload  Upload   Total   Spent    Left  Speed
100  309k    0  309k    0     0   184k      0 --:--:--  0:00:01 --:--:--  184k
Connect: 0.001100 TTFB: 1.670056 Total time: 1.673938
TTFB/CURL via Terminal test (NGINX FastCGI Enabled)
$ curl -o /dev/null -w "Connect: %{time_connect} TTFB: %{time_starttransfer} Total time: %{time_total}" https://slovenia-trips.com/
  % Total    % Received % Xferd  Average Speed   Time    Time     Time  Current
                                 Dload  Upload   Total   Spent    Left  Speed
100  309k    0  309k    0     0  21.5M      0 --:--:-- --:--:-- --:--:-- 21.5M
Connect: 0.000887 TTFB: 0.010282 Total time: 0.014403
Summary
Server can now serve 400+ reqs/sec with very low TTFB times for all cached pages. CPU utilization is also much lower.
A true game changer.


